
Instructors use several grading policies to provide students feedback on learning and to inform instructional decisions in the classroom. Grading policies should be clearly communicated and transparent. Some suggestions include:
Many teachers weight categories of coursework to arrive at final grades. Here’s an example of how weighting works:
| Category | % in Category | X | Category weight | Grade |
|---|---|---|---|---|
| Participation | 100.00% | X | 10% | 10.00% |
| Midterms (2) | 84.40% | X | 50% | 42.20% |
| Final | 93.20% | X | 40% | 37.32% |
| 100% | 89.52% |
In the example above, it seems fairly straightforward to apply a straight percent for the grading policy where students with 90% to 100% receive an “A,” 80% to 89% receive a “B,” and so on. Unless the professor rounds up, this student with an 89.52% will receive a B. Generally in practice courses don’t have cut scores that are, well, so clear cut. But what’s to say that 90% is “A” work? What happens if the entire class performed poorly on the final exam, and this student received the highest score. Frequently, professors adjust the grading scale at the end of the course, similar to a curve. To see more on grading, read our blog on the problem with letter grades.
The curve assigns grades on established allotments for each grade category. Way back when I attended Wharton, here’s their grading policy based on a fixed quota system as follows:
Distinguished (DS) 10%
High Pass (HP) 15%
Pass (P) 55%
Qualified Credit (QC) 10%
No Credit (NC) –
Fixed quota systems such as Wharton’s have several problems. For example, what happens if a student in the “P” and dreaded “QC” buckets are hardly distinguishable. Some instructors use normal or bell-shaped curves instead of cuts, but the results are nearly as arbitrary as the fixed quota system.
As a side note, Wharton also had a no grade disclosure policy. Potential employers were not allowed to ask about grades, and students were forbidden to disclose grades. The system encourages students to take classes that interested them rather than taking classes that were easier to get high marks. Of course, if you wanted to graduate as the Palmer Scholar, grades mattered.
Some instructors use gaps in a histogram to determine grade cuts. Below is a histogram from GradeHub.
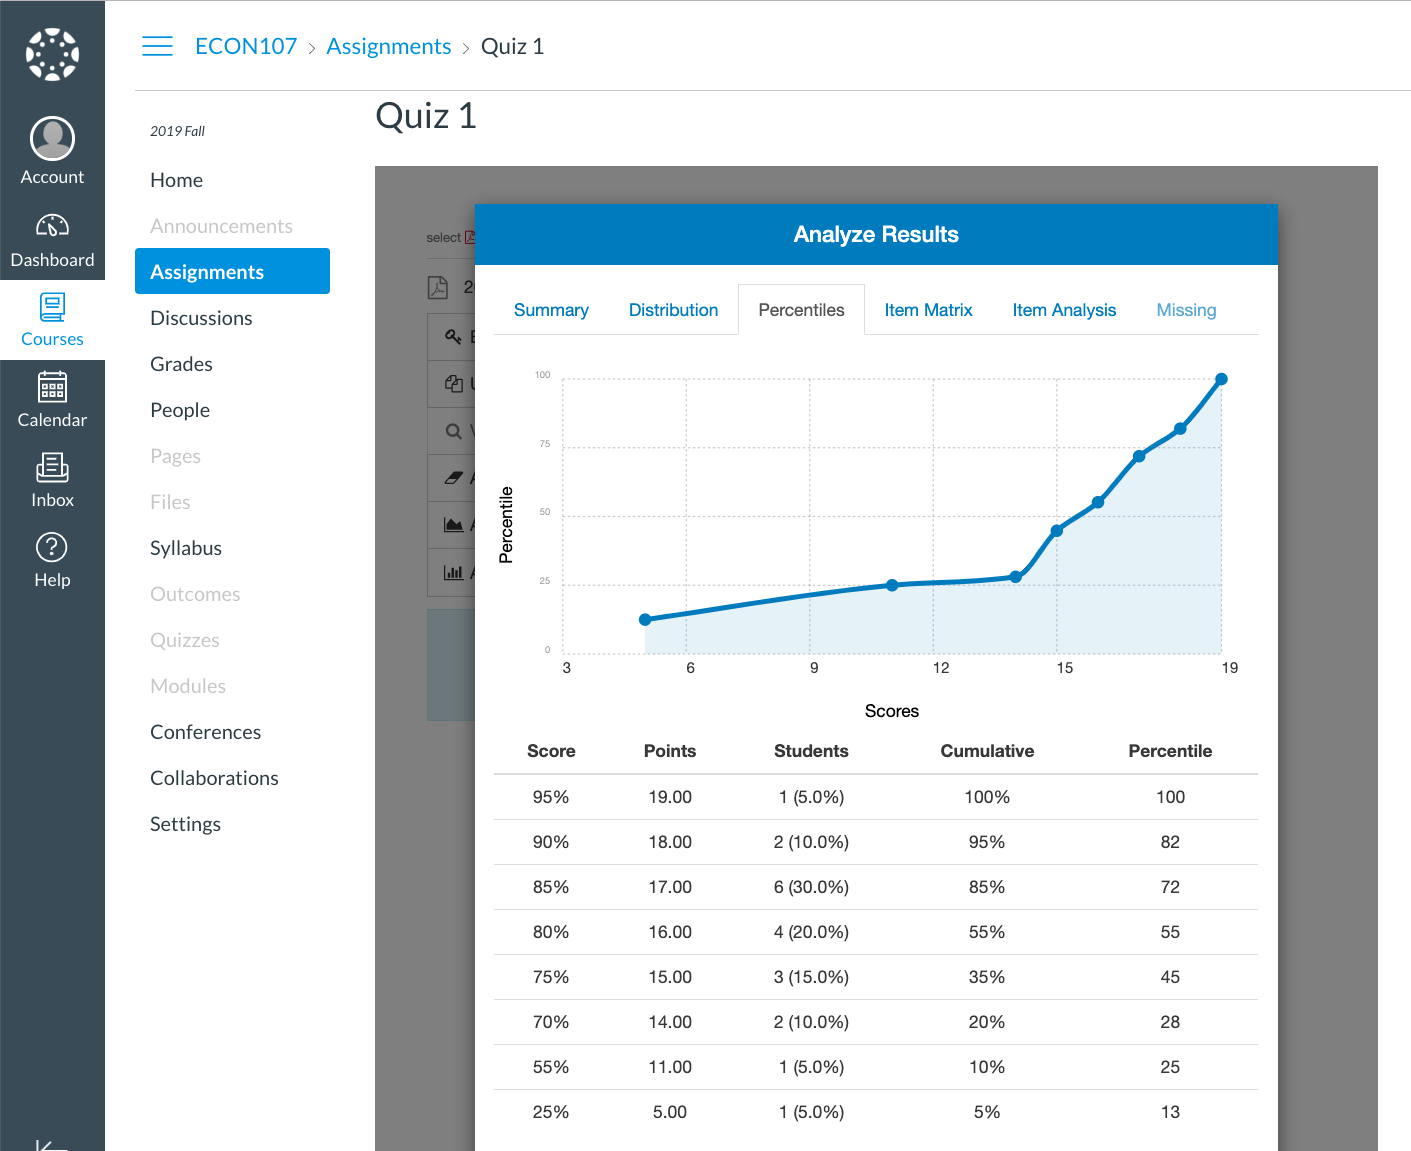
This method is also very also arbitrary. In this example, you can see a clear break at 90%; the instructor could use this as the “A” cutoff, then use somewhere above the 0.775 mean as the “B” cutoff, and so on. If the same test were given to a subsequent class, it is highly likely that the gaps would appear elsewhere, making this method suspect at best.
Different exams, homework assignments, and papers can have different averages and distribution. To compensate for these difference, some teachers convert raw score points to z-scores or also known as standard scores. Standard scores measure grades from different sources on the same scale or “yardstick.”
A z-score is the number of standard deviations score was from the mean. Centered around the mean, a z-score of 0 indicates the student got the class average. Above 0 indicates performance above the mean and negative numbers show grades below the mean.
To calculate a z-score, do the following:
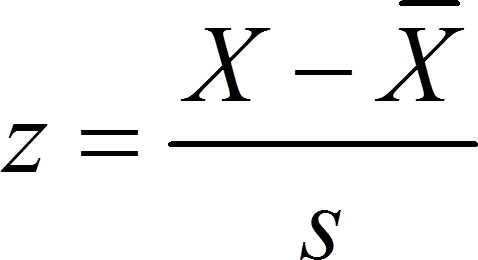
where:
X̄ = mean score
X = the student score
S = standard deviation of exam
Here is the procedure step-by-step to use z-scores combined with weighting :
| Midterm | Final | Z-score | Grade | |
|---|---|---|---|---|
| Average | 73.30 | 68.90 | ||
| Standard deviation | 7.70 | 8.70 | ||
| Student scores | 87.00 | 82.00 | ||
| Z-score | 1.78 | 1.51 | ||
| Weight | 0.40 | 0.60 | ||
| Weighted Z-score | 0.71 | 0.90 | 1.62 | A |
| Letter Grade | Upper | Lower |
|---|---|---|
| A | >1.5 | |
| B | 1.5 | 0.5 |
| C | 0.5 | 10.5 |
| D | -0.5 | -1.5 |
| F | <-1.5 |
In the grading scale above, we used the mean or a z-score of 0 as the midpoint to calculate the grading scale. One-half standard deviation above and below the mean represents a “C.” Add one standard deviation to the upper cutoff of the C’s to find the B and A cutoffs. Subtract one standard deviation to the lower cutoff of the C’s to find the D and F cutoffs. Since the student received a 1.62, or more than 1 standard deviation above the mean, the student received an “A” for the term.
Theoretically, the median is a better indicator of central tendency than the mean. For this reason, many instructors prefer to use the z-score of the median as the midpoint of the “C” range instead of the mean. If the mean approximates the median, then instructors should feel comfortable using the mean. Otherwise, the teacher using z-scores should use the median.
We’re here to help,
Mark Espinola