
GradeHub exam statistics leverage knowledge from industry experts and our CEO + Co-founder (President / CEO of three assessment companies) to provide reports to help instructors understand exam results and write better exams.
Key GradeHub exam statistics with interactive graphical features include:
Reports are automatically available to instructors and students in their LMS login. Students receive GradeHub feedback only after the instructor “releases” scores. When scores are released, GradeHub syncs scores to the grade book (our Blackboard integration is shown).
The Student Analysis report includes raw scores, P-values, Z scores, the answer key scored, and student responses by a student. The Answer Key and Responses can be edited by the instructor. The blue link for each student name will “fetch” the completed student answer sheet.


Summary GradeHub exam statistics are provided for the test automatically in your LMS (Blackboard showed). Instructors can export exam information from this tab too.
The key exam statistic on this page is test reliability using Cronbach’s Alpha (⍺). Cronbach’s Alpha (⍺) is a measure of the likelihood your test will produce consistent scores. Reliability coefficients theoretically range from zero (no reliability) to 1.00 (perfect). Generally speaking, classroom tests range from 0.50 to 0.95 depending on the intercorrelation of items, test length, and diversity of subject matter. If test reliability is below 0.50, the instructor should consider adding additional questions and revising poorly written questions on future exams.
To explain reliability, we often use the analogy of a bathroom scale. If you step on and off the scale several times, you’re going to expect your weight to be the same. If it’s not, the scale is not a reliable instrument to measure weight. Similarly, an exam with a low “Alpha” is an unreliable instrument to measure knowledge.

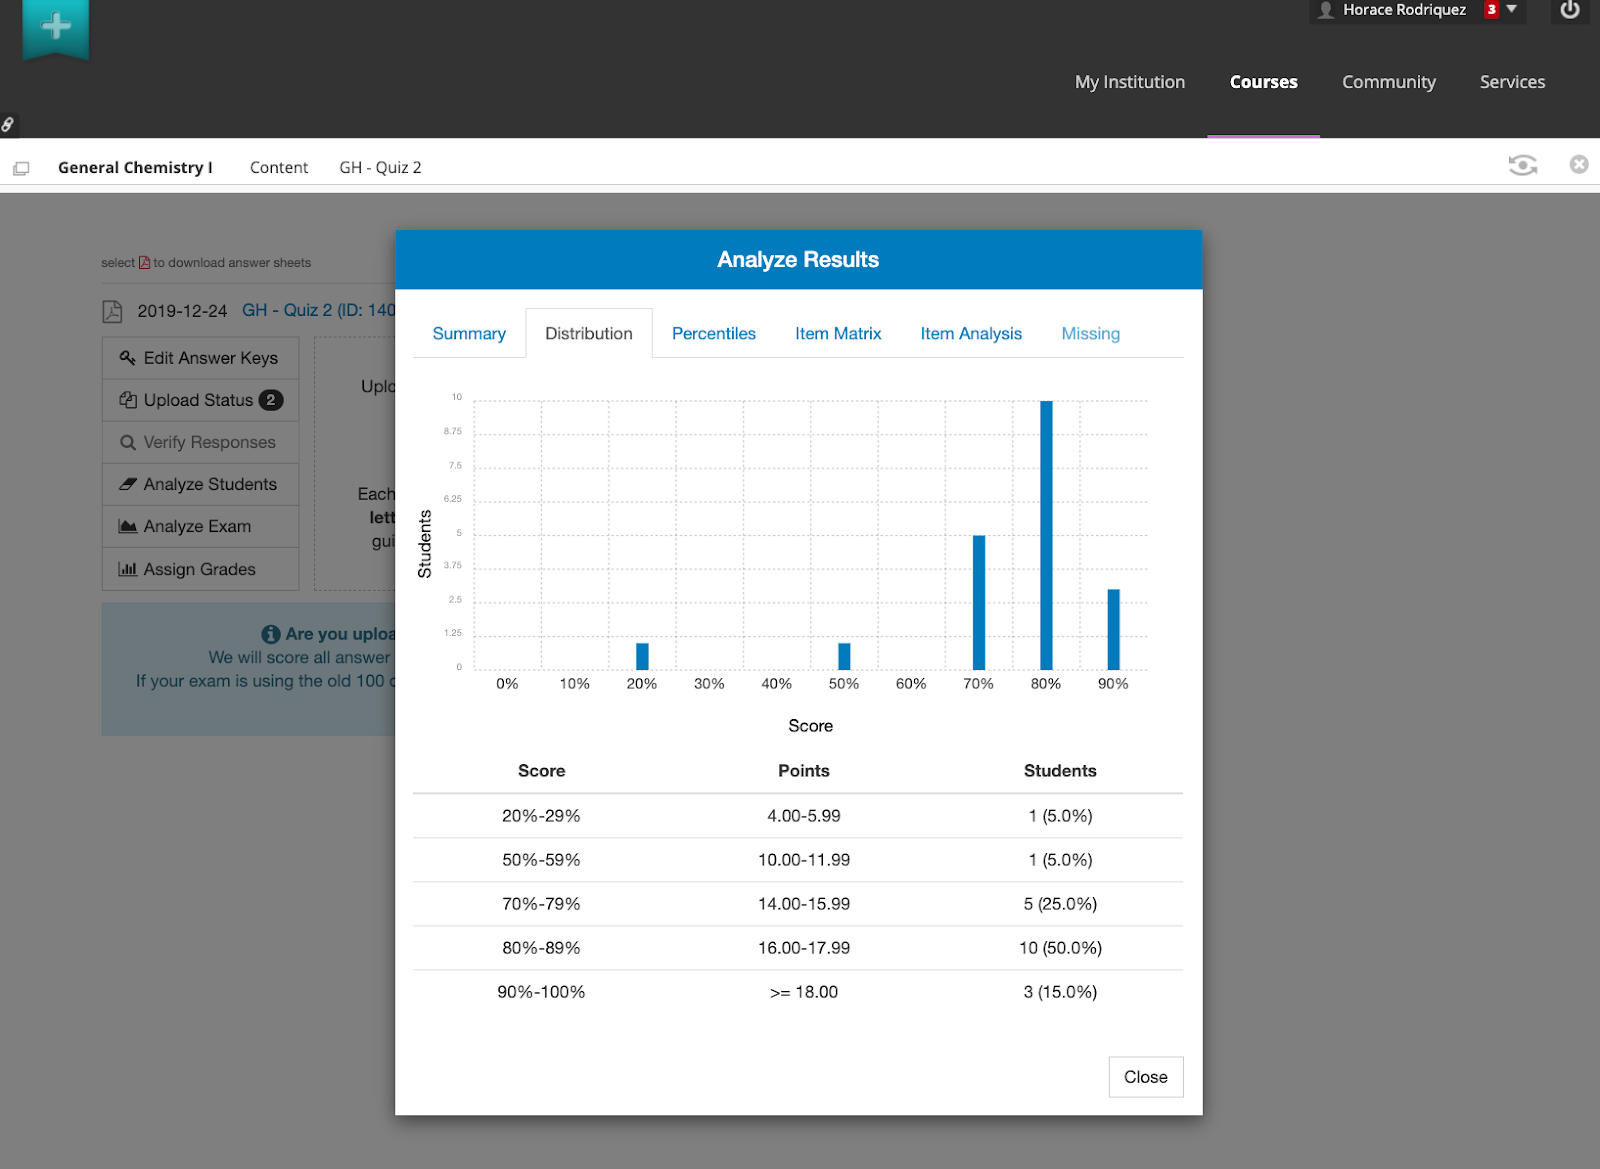
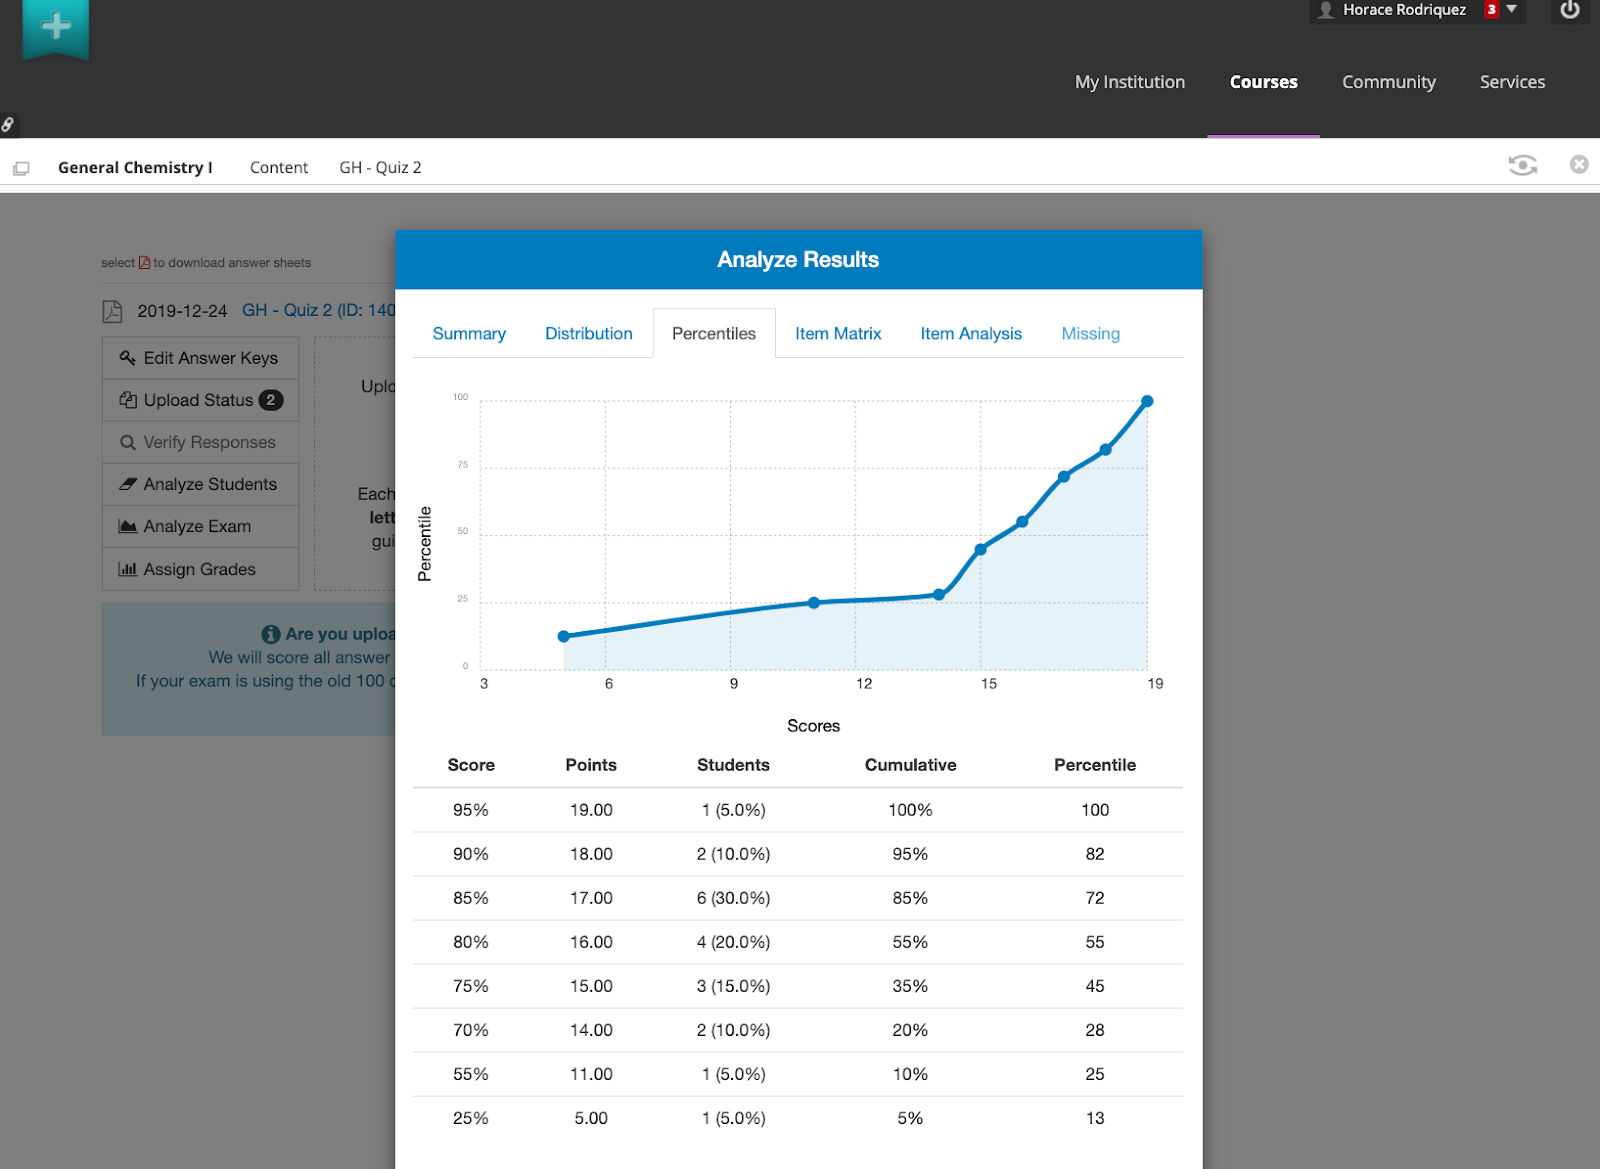
Exam distributions and percentiles help instructors understand the spread of scores, which might indicate the need to curve the exam.
GradeHub exam statistics provide a summarized item analysis to help instructors easily view their highest performing questions and questions that need reevaluation. The report also shows how well written and difficult the exam was.
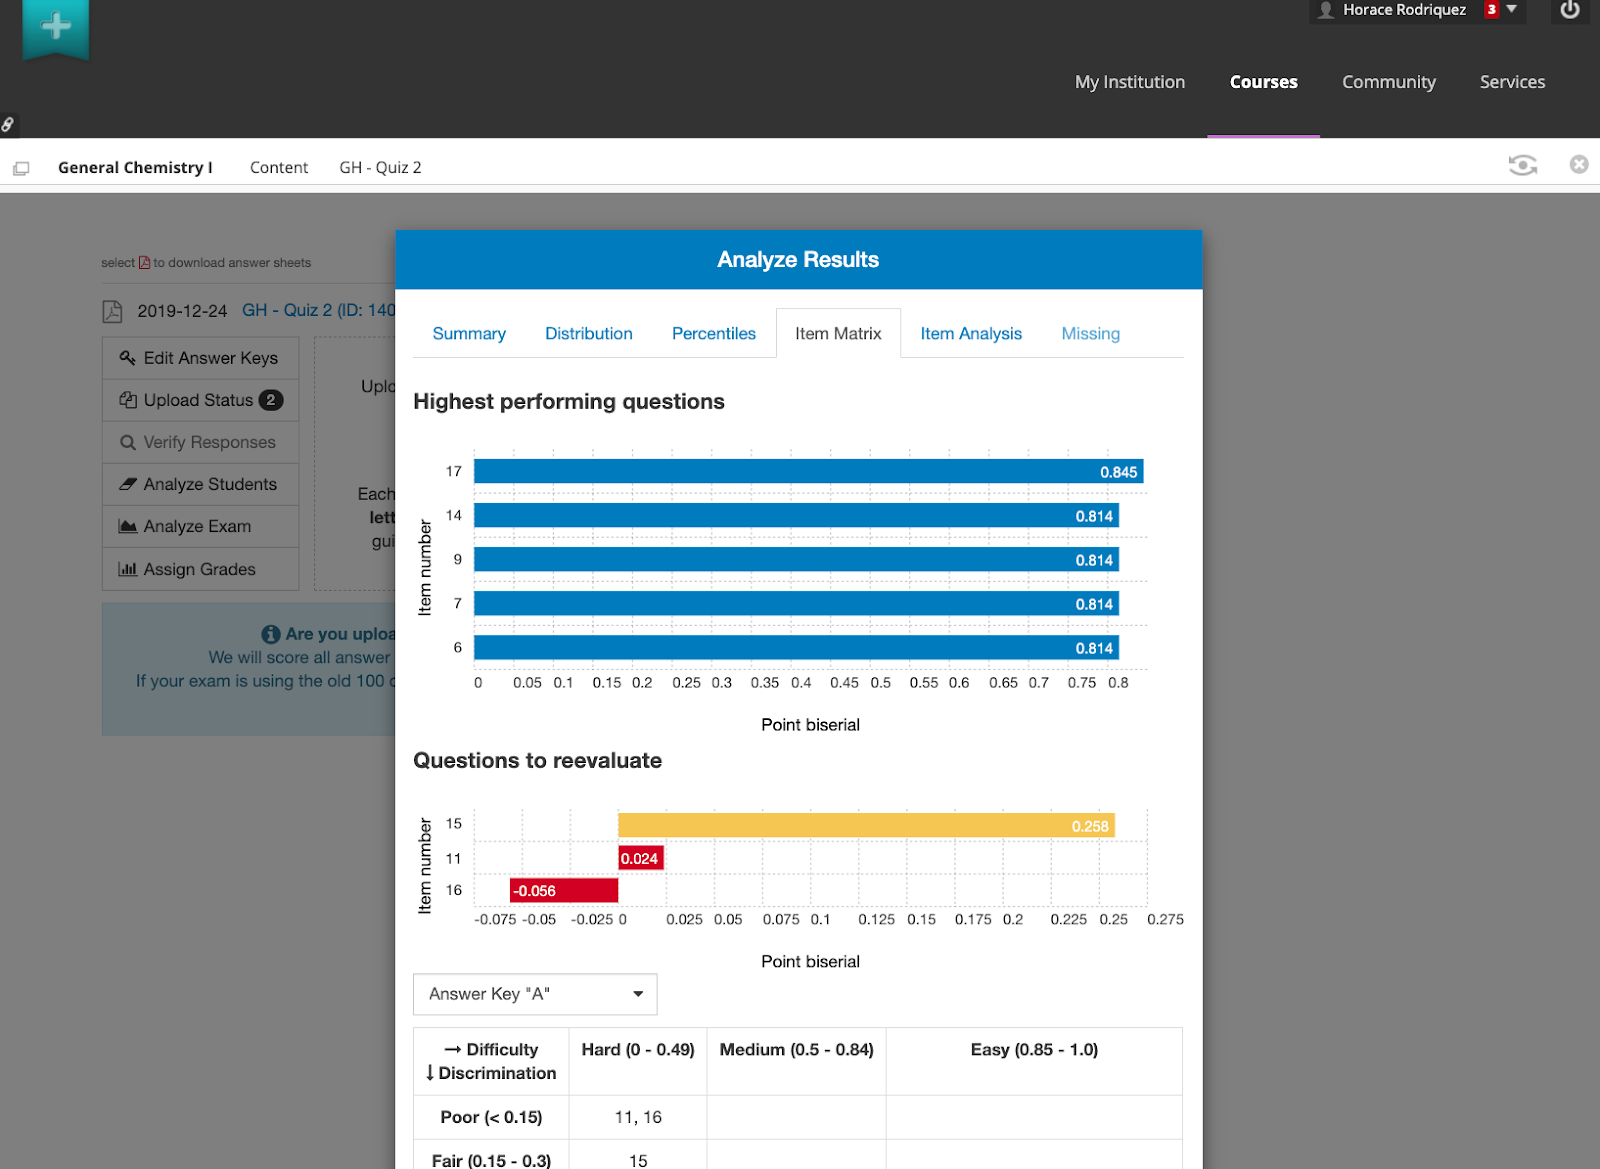
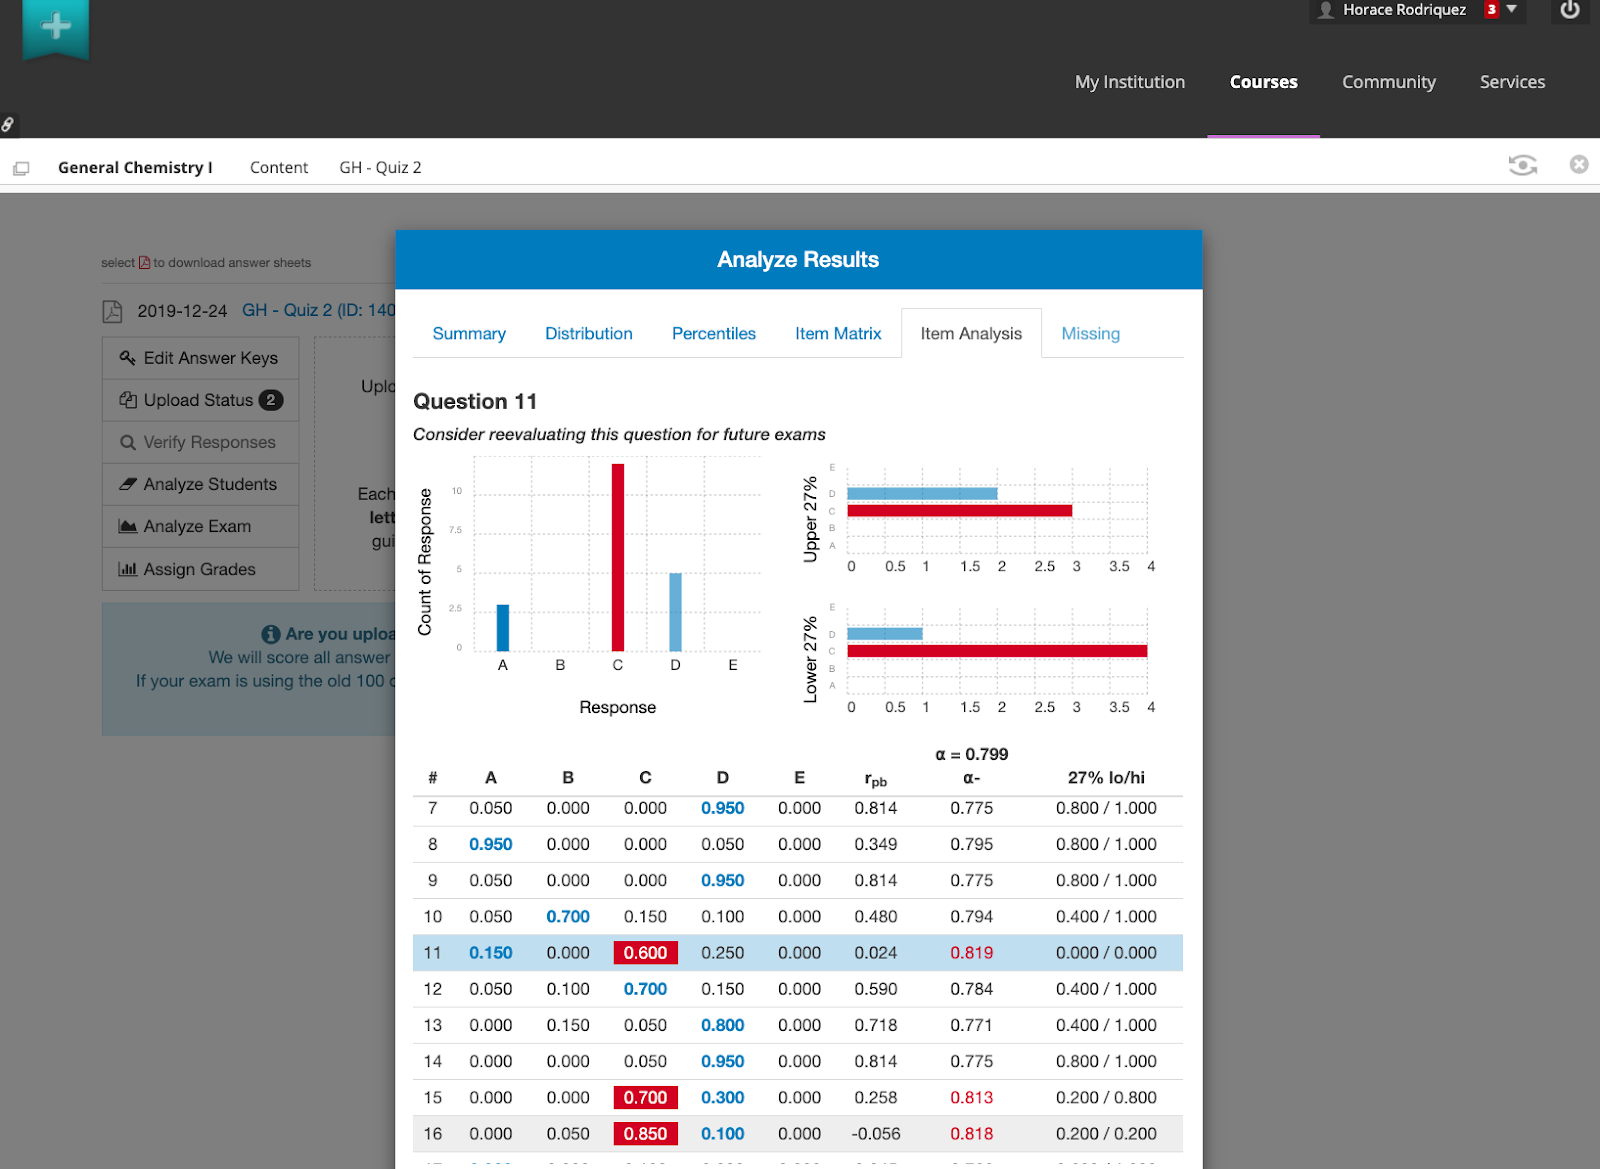
GradeHub provides a number of powerful statistics to determine item quality including response analysis, point biserial correlation, upper and lower performance groupings, and Cronbach’s Alpha with Delete. Color and bolding are used to identify correct responses and where most of the class is missing a question. With this analysis, teachers can quickly identify areas where students are struggling and how to improve the exam for future test administrations.
We get feedback from faculty members several times a week. Often, the positive comments come after the first time an instructor uses GradeHub and from some of the universities’ largest and most demanding instructors. From our experience, the anticipated “friction” from implementing a change like GradeHub is welcomed by teachers and TAs. We believe because GradeHub is so easy to use while providing instructions immediate and comprehensive feedback.
Here’s what instructors are telling us:
